The analytics software I installed the other day is working right nice at the moment. I’ve never been one to monitor my site usage or statistics because they’ve never interested me, and I don’t blog for an audience. Still, I’ve been looking for an easy way to at least see what’s going on, and this new package has indeed given me some great overviews.
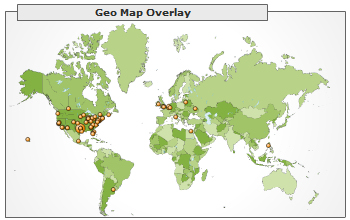
Here’s one day of traffic based on where the viewer is located. Again, this is one day, so this map will grow more crowded (cumulatively) as time goes on. I just thought I’d share this as it’s pretty cool to see.
Note that each dot is a specific location where one or more people visited the site and does not represent the number of viewers from each spot.
